PadiHAT — water in the paddy, measured from orbit and from the mud
A solar-powered LTE field node that measures water depth in a rice paddy, and the app that turns it into an irrigation decision. Custom PCB, ESP32-S3 firmware, MQTT backend, React dashboard and a Flutter app farmers install themselves by scanning a QR code.
PadiHAT
Alternate wetting and drying (AWD) saves a great deal of water in rice cultivation, but it only works if somebody knows how far the water has dropped below the field surface. Traditionally that means walking out to a perforated observation pipe and looking into it. PadiHAT is the instrument that does the looking, and PadiGO is the app that tells the farmer what it saw.
The node
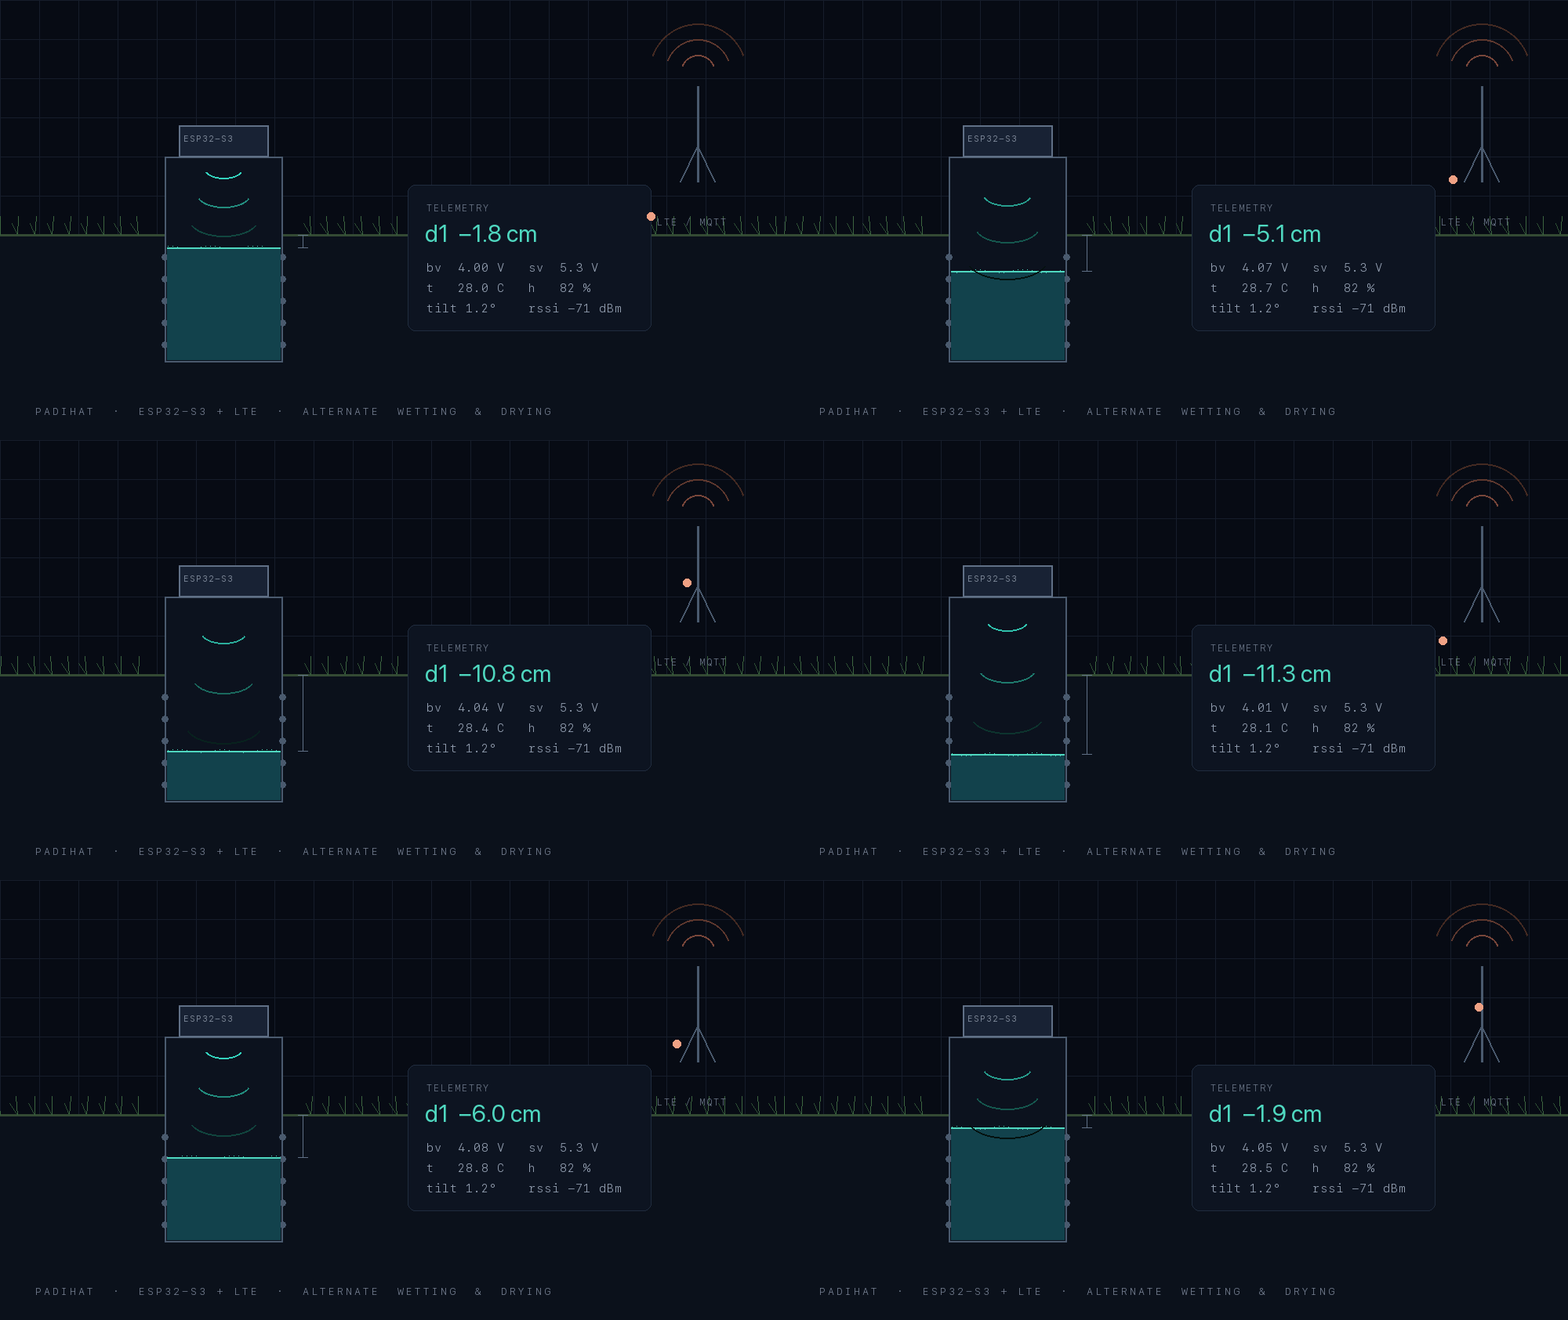
An ultrasonic sensor sits at the head of the observation pipe and measures down to the water surface. Behind it is an ESP32-S3 with an A7672S LTE and GNSS module on a board designed for the job — now on its third PCB revision — running on solar with a battery buffer.
Each wake cycle publishes exactly one MQTT telemetry payload and goes back to sleep. The payload carries the short keys the live backend already ingests (bv, sv, t, h, d1 …) with the v0.3 board's diagnostics appended: accelerometer tilt, RTC temperature, an external SHT40, solar state, cell-tower diagnostics, per-phase timing, a failed-boot ring buffer, runtime health and the firmware SHA. The extras land in raw_payload until the server is taught to read them — a deliberate choice, so a new firmware can ship diagnostics without waiting on a backend release.
Firmware updates ride the same broker: every wake, the device subscribes to a retained cmd/<mac>/update topic.
The app a farmer can actually install
PadiGO is Flutter, with JWT auth and farmer, manager and admin roles. Registering a node is a QR scan against a padigo:<uid>.<mac> token, validated with the backend, followed by a seven-step illustrated guide for physically installing the pipe. GPS is auto-filled or typed.
Day to day it shows animated pipe diagrams of current water depth, seven-day charts per device, battery and temperature, and a map whose pin colours are battery state. Managers get one more layer: Sentinel-2 NDWI and LSWI overlays from Copernicus, so the field can be read from space and from the mud in the same view.
The rest of it
A Python backend handles MQTT ingest and the REST API; a React dashboard carries the live readings and the calibration editor for the people running the fleet.